Card visuals are a great way to show KPIs, important numbers and useful information in Power BI. But most cards look dull and boring. So in this article, let me share 5 ways to spice them up.
Trick 1: Show off your colors
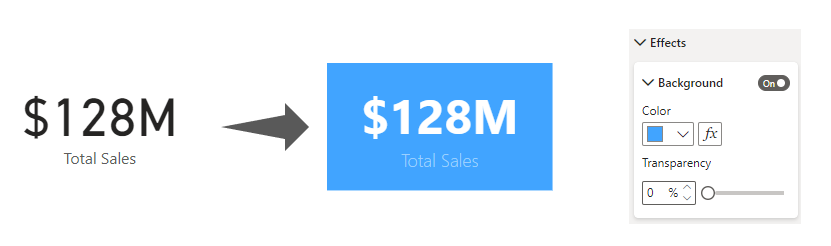
You can apply a strong background color on the card to change the way it looks. Select your card(s) and from the format panel, set background “effect”.
Trick 2: Round those borders
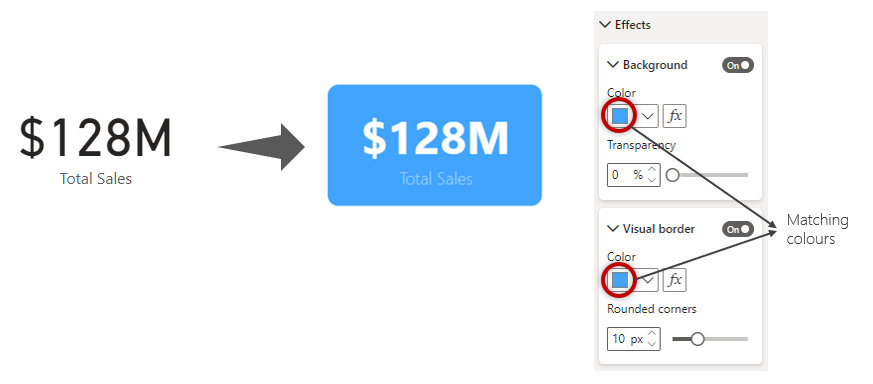
Rounded corners look better than hard edges. Setting them up is so easy too. Go to effects and add borders. Set border radius and match the border color with the background color.
Trick 3: Cast a shadow
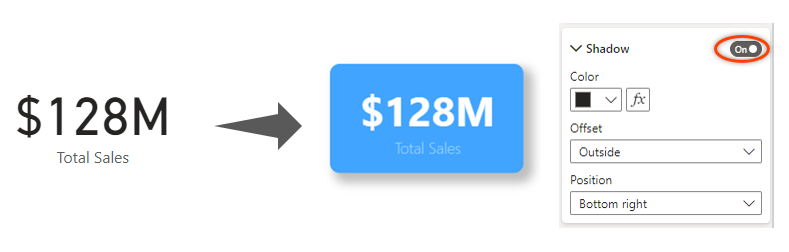
If you add a mild-shadow to the cards, they elevate on the report. To set the shadow, go to “effects” and enable the Shadow option. Adjust the default colors if you want.
Trick 4: Subtle Style with Accented Cards
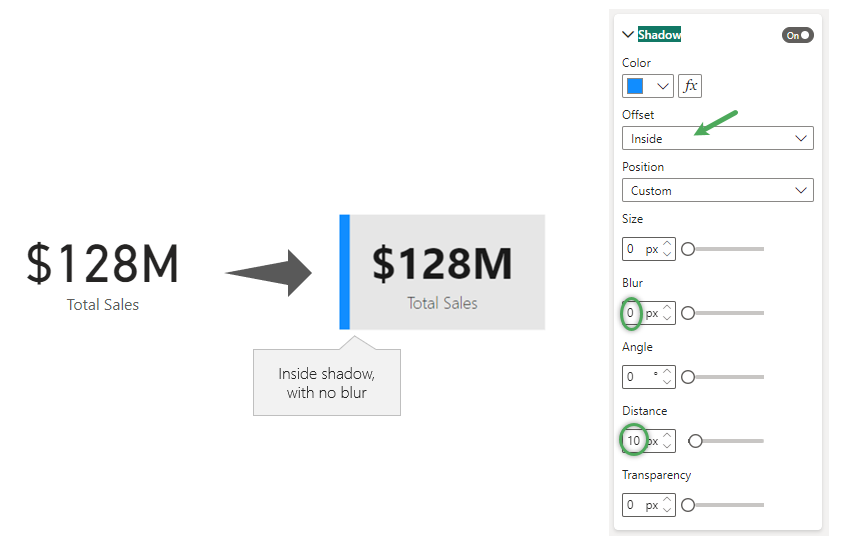
Ok, now it’s time to really shine. We can creatively mix the shadow effect for a cool accented card style.
To do this:
- Set up shadow
- Change the shadow offset to Inside and position to “Left”
- Now you will get an inside left shadow
- Change the position to custom now.
- Set blur to 0 and adjust the color & distance.
- You get a cool accent bar in the card!
Trick 5: Get a reaction with Emoji 😍
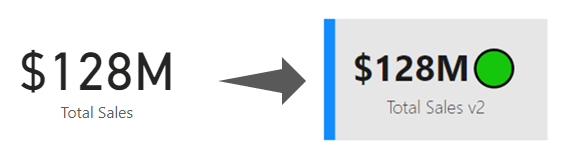
While the first 4 tricks require adjusting the colors or settings, this one requires writing some DAX.
Let’s say you have a [total sales] measure. And you want to indicate how good (or bad) these sales are.
If the sales are above $120M they are good, Anything above $100M is ok and under $100M is bad.
We can create [total sales v2] using below logic:
Total Sales v2 =
    var ts = [Total Sales]
    var symbol = SWITCH(true(), ts>120000000, "🟢",ts>100000000, "❗", "❌")
return
    FORMAT(ts, "$#,##,,M")& symbol
💡 Tip: To get emoji symbols in the DAX, press Windows & DOT (period) keys together.
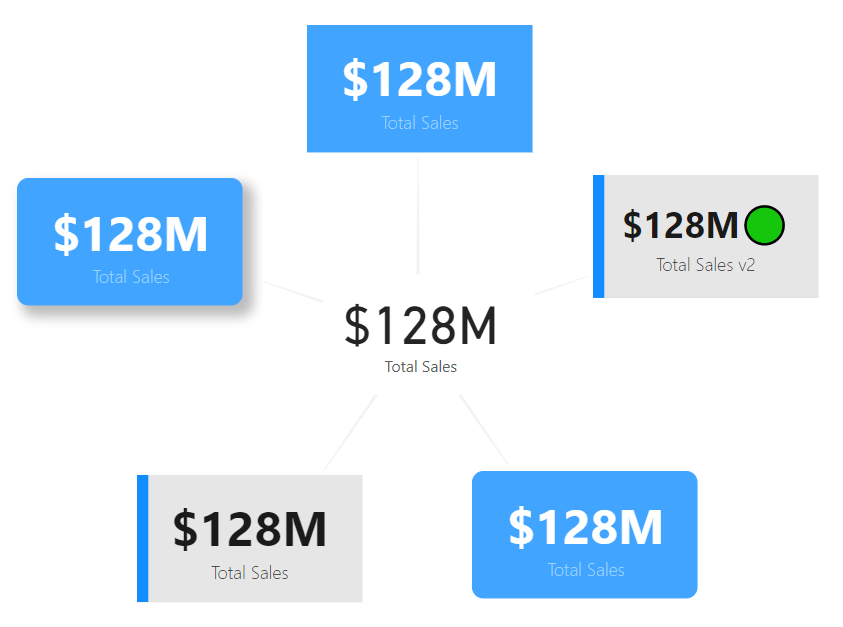
Demo of the Card Tricks:
Here is a quick demo of how these styling tricks look. Use the slicer to test the emoji card.
Video – 5 Power BI Card Tricks
A while ago, I made a video on this topic (with slightly different tricks). Check it out here if you want more inspiration. (click here to watch the video on YouTube)
How do you style your cards?
Which trick(s) do you use to style your cards and make them pop? Share your thoughts and tips in the comments section below.